Group Portrait in Broad Strokes: Results of the Class of 1969 50th Reunion Survey
Class surveys have been a regular feature of 50th reunions for years, and—as we have with so many traditions—Yale ‘69ers might well wonder what purposes this elaborate group ritual might serve. The reunion committee had several purposes clearly in mind: to gather information that would inform several invited essays planned for this volume; to activate interest in class affairs as a prelude to the reunion itself; and to take the measure of where we stand as a class and how we’ve changed as a group. Bound up with the latter purpose is the compelling interest many of us have as individuals: to see where we stand in relation to others in our class. Some might dismiss this seemingly morbid interest as egotistic navel-gazing, or a hold-over of our too-competitive youthful years, but we know from studies of the life course and of aging that a primary psychological task of the older adult is to discern the meaning of his or her own life story. (Some of you may recall from Psych 101 that Erik Erikson called this late-life stage of development—typical of those over 65—“Integrity vs. Despair”). Yes, it’s natural for guys our age to look back and try to figure out what it all means, and given the power of the Yale undergraduate experience, it’s also natural that a highly significant reference group for many of us would be our Yale classmates. So, if you’re wondering how your life and your current situation stack up against the rest of the class, you are not alone and you’ve come to the right place. A simple survey questionnaire can’t quite penetrate to the level of deeper meanings and surely misses the nuances of the individual portrait of any one classmate, but it can give us a broad portrait of the class as a whole (and of some subgroups among us.)
With the help of classmates Mike Baum, Wayne Willis, JP Jordan, Reed Hundt, Doug Colton and others (and a copy of the questionnaire used by the Class of ’68), we tried to ask questions that would serve all of these purposes—and add a bit of fun to things, as well. The survey covers many topics of potential interest: basic demographics, significant life events, careers, a bit about politics, our health (including sex lives), relationship with Yale, measures of religiosity (analyzed by Mike Baum in a separate essay in this volume), and questions about our plans for retirement and the future. We also included a question series (the Moral Foundations Questionnaire) intended to assess the basic values of our classmates, and the results of that measure proved to be quite revealing.
How we did the survey
The reunion committee enlisted the aid of the University of Virginia Center for Survey Research [CSR] to assist with fielding the questionnaire. I founded that center thirty years ago and have directed it ever since, and I donated my time to the project, drawing on my experience and professional knowledge as a survey methodologist. We decided that the survey would be fully anonymous. The survey was fielded as an on-line instrument using the Qualtrics survey platform, and to preserve anonymity we asked participants to tell CSR if they had completed the questionnaire (or if they wished to opt out) by filling out a separate on-line form. CSR communicated with living members of the class—including those overseas and those without email addresses known to Yale–through several postal letters and cards, emails containing appeals from class leaders, postings in the class Web pages and electronic newsletter, and finally through reminder phone calls from CSR to non-respondents. The result was highly gratifying: men from the 12 residential colleges responded at nearly equal rates. From 924 living class members on our initial list we obtained 579 usable responses, meaning we heard from 63 percent of the names on the list or about 70 percent of those with current contact information available. This means that the statistical margin of sampling error on the overall result is just ±2.5 percentage points.
Who we are
Let’s start with some basic demographics. To preserve anonymity, we didn’t ask for addresses or 5-digit ZIP codes—just the first digit of the ZIP code. As seen in Figure 1, we are mostly a bi-coastal class, with over half the class living in 1-digit-ZIP areas near the East Coast and 19 percent on the West Coast. (A feature on the class website [https://yale1969.org/where-we-live/] offers a more detailed map of the entire class, showing that about half of us are located in the Boston-Washington megalopolitan corridor.)
Figure 1. Respondent residence location by 1st digit of ZIP code.
Eighty-four percent of us are currently married. Fifty-nine percent have been married only once; 32 percent have been married twice; 4 percent have been married three times or more, and 5 percent of us never got married. As a class, we’ve been married to an estimated 1, 171 people. If you’re wondering about the sex of our spouses: we didn’t ask that, but about three percent of our classmates report that they came out as gay at some point in their life.
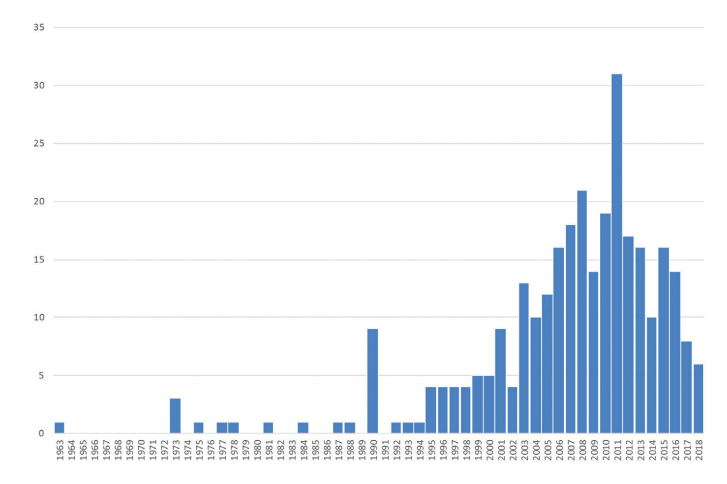
First comes love, then comes marriage, and the baby carriage follows soon thereafter. We have been quite fertile. Extrapolating from the respondents to the entire class, we estimate that we have been fathers to 1,749 biological or adopted children and 468 stepchildren. As seen in Figure 2, most of us had our first child in our late twenties or early thirties, with our peak year for starting a family occurring in 1981 (when most of us were about 34). We’ve had 1,888 grandchildren and 511 step-grandchildren. As seen in Figure 3, the peak year for that first grandbaby was 2011 (when most of us were about 64). And as of Spring 2018, there were already 121 great-grandchildren and 95 step-great-grandchildren of our class, bringing the total estimated offspring of our class to 4,832.
Figure 2. In what year was your first biological or adopted child born?
Figure 3. In what year was your first biological or adopted grandchild born?
As we all know, back in our day Yale admissions opened up more opportunities for public school grads to gain admission; 54 percent of the survey respondents went to public high schools. Grads from private, residential prep schools comprised 27 percent of the class, with 19 percent having gone to private day schools.
If you’re thinking that Yale College was a liberal arts school, you’re right. Looking at what we did while at Yale, the survey finds that 53 percent of the class majored in the humanities (including Humanities, Arts and Languages, and American Studies), 26% majored in the social sciences, and only 11 percent in natural sciences or math (plus two percent more in Engineering). Administrative Science and Economics drew two percent of our number, and architecture just one percent.
We were a busy bunch outside of class, too. Forty-one percent of the survey respondents had played on a sports team for their residential college, while 24 percent played on a varsity sports team. Twenty-five percent of our respondents were fraternity members, while 36 percent reported being members of a senior society, either above ground or underground. Thirteen percent were members of the Yale Political Union, 14 percent were on campus-wide publications (or WYBC), and 17 percent belonged to a singing or music group at Yale. Twenty percent of respondents did local volunteer or charity work while at Yale.
We should pause here for a moment to consider the possibility of non-response bias in these percentages. It is likely that the survey was more appealing to men who were active at Yale, feel affiliation with Yale, and who see themselves as successful in life. Although the survey has a remarkably high rate of response for a Web-based survey, it is still true that about a third of our classmates did not respond. If these non-respondents differ substantially from the respondents in their level of involvement at Yale, then the percentages reported in the survey will be somewhat higher than the true percentage in the class as a whole. The same could be true for measures of success in life, involvement with Yale affairs, and some other positive characteristics reported below. Our persistence in issuing repeated survey reminders to non-respondents through various channels militates against it, but some degree of non-response bias is unavoidable in a survey of this nature.
What happened to us?
Our studies at Yale were carried out in the shadow of the draft, the Vietnam war, and the first national draft lottery that took place just seven months after we graduated. Figure 4 shows that about a fourth of the class (24 percent) ended up serving in the military, although few who served were actually drafted; about a third drew deferments, and nearly 30 percent drew high lottery numbers that kept them safe from being drafted. (Later in this report we’ll look at our views of the Vietnam War, then and now.)
Figure 4. US Military Service
 Five percent of our classmates went on to serve in the Peace Corps or in some other volunteer initiative for more than six months.
Some bad stuff has happened to some of us, too. Nine percent have been a victim of violent crime in their lifetime. Seven percent have had a major auto accident requiring medical treatment. Three percent have been arrested for a non-traffic crime, including 2 percent who were convicted. And one percent reported that they had at some time attempted suicide.
How did we do?
If you think everybody else in our class went on to become a lawyer, a doctor, or an entrepreneur, that’s not a complete picture. As Figure 5 illustrates, the largest field for our classmates was education (15 percent of us), with law (13 percent) and healthcare (9 percent) trailing behind. Finance and business occupied eight percent each, and several other fields drew in significant proportions of our classmates.
Figure 5. 12 most common fields we’ve worked in since graduation
 The questionnaire asked each classmate what his career was like after he completed his education and any obligatory military service. The majority (55 percent), said they entered their chosen career and stayed with it. Seventeen percent reported one major change in occupation, while 10 percent had several career changes. Eight percent chose “I did pretty much the same thing all my life, but in multiple industries or fields.” Only two percent said “I just went from one thing to another, no real pattern.”
Our employment patterns were pretty steady for most of us, but not for all. When we asked how many employers our classmates had worked for full-time in their life, we got the results seen in Figure 6. While eight percent actually worked for only one employer, the most frequent responses were “two employers (16 percent) or “three employers” (18 percent). Five percent of us had 10 employers or more in their life-time. Asked if they’ve ever been fired or laid off, nearly two-thirds (63 percent) said “never,” but 20 percent said “once,” 11 percent said “twice,” and six percent said “several times.”
Figure 6. How many employers (full-time) in your life?
 We are an entrepreneurial bunch, to be sure. About 50 percent of us have started a business at some point. About 5 percent have actually taken a company public. Twenty-three percent have sat on boards of for-profit companies. But a much higher 62 percent have sat on boards of non-profit organizations. And we have other accomplishments as well: nearly half of us (49 percent) have published a book or an article in a scholarly journal. Nineteen percent have published regularly in either print or electronic media. Six percent have run for public office, and eight percent have “won an election,” which must include elections for posts outside of public office.
We all know that money isn’t everything, yet we still thought it important to ask about financial success, measured as self-reported net worth. We certainly haven’t done badly as a class, with the median net worth coming in at $3.7 million dollars. As seen in Figure 7, the largest number of us (43 percent) have net worth in the one-to-five million dollar range. One in five of us has net worth over $10 million dollars, including the six percent worth over $25 million. (As a reminder, the survey was fully anonymous and none of this information was or will be shared with the fund raisers in the development office. As the survey said: “No salesman will call . . . ,”)
Figure 7. What’s your household net worth today?
 Our politics
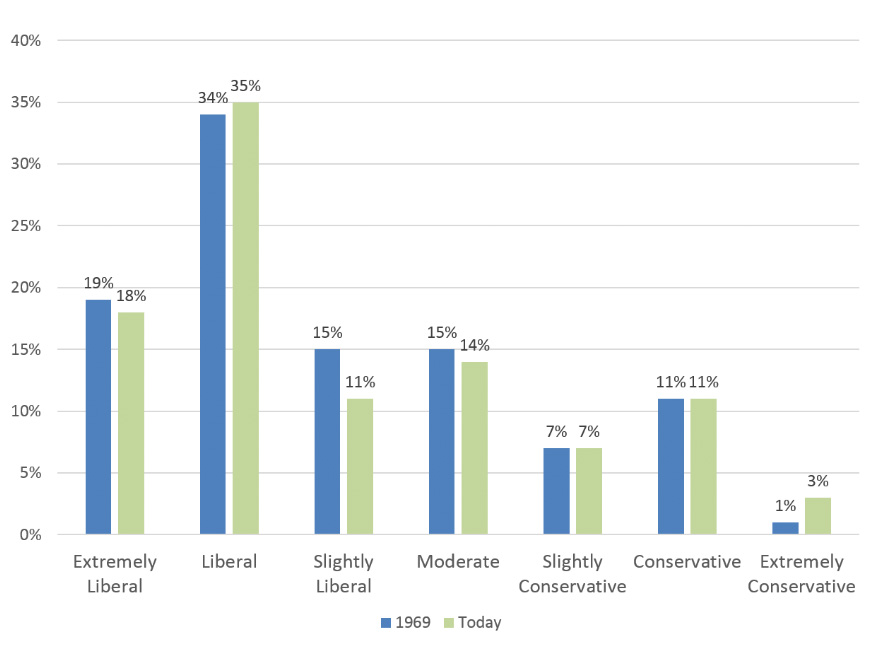
I think it’s fair to say that our class was less radical than the students at some other colleges in the sixties, but it turns out that we were and are a liberal bunch. Figure 8 shows our self-described political views during our time at Yale and in the present. Back in 1969, 67 percent of us were liberals, 15 percent were ‘moderates,’ and the remaining 18 percent were conservatives. Most of the liberals do not describe themselves as having been ‘extremely liberal’ back then, but the leftward tilt of the class as a whole is obvious. It is often presumed that people get more conservative as they age, but not so much for our class: today’s distribution of viewpoints is, compared to 1969, only very slightly more conservative (21 percent) versus 64 percent still calling themselves liberal.
Figure 8. Liberal vs Conservative, in 1969 and today
 The story is only a little different for party identification. In 1969, 53 percent of us were Democrats, 24 percent were independents, and 20 percent were Republicans. (Libertarians, Greens, and other party labels accounted for the remaining three percent). Today, Democrats have increased their share of our loyalties to 58 percent, 24 percent are independents, and only 14 percent say they are Republicans. (We offered the category of “Tea Party,” too, but nobody chose that label.) In fact, 50 percent of us today call themselves “strong Democrats,” contrasting starkly with just six percent identifying as “strong Republicans.”
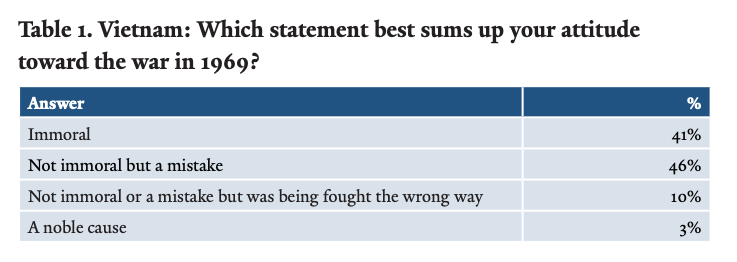
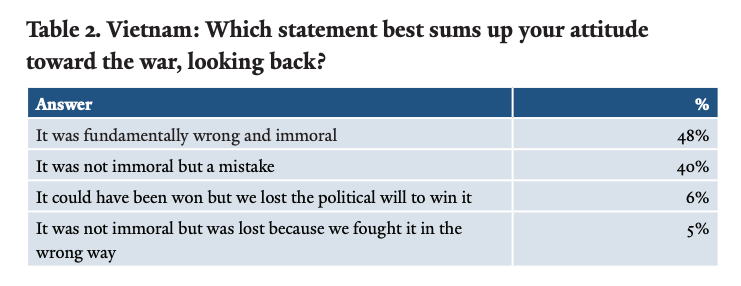
With President Trump finishing up his first year in office as our survey went into the field, it was tempting to add a series of political questions to the survey, but we refrained from doing so, in part because we guessed that the burning issues of early 2018 might be of only passing interest from the perspective of the reunion date in June 2019. However, we felt it was important to ask about one issue that was of paramount importance to us during our college years: the Vietnam war. We asked first about the attitudes our classmates held in 1969; we then asked them to look back at the war from the present. As seen in Table 1, based on our recall of 1969 and our self-reports, very few of us still thought of the war as “a noble cause” in our senior year of college, and 87 percent of us were against the war. Forty-one percent of us thought the war to be immoral, while a somewhat larger number (46 percent) saw the war as a mistake, but not immoral. From our vantage point in the present, as seen in Table 2, there is less change in these opinions than one might have expected. Now 88 percent take the anti-war positions, compared to 87 percent in 1969, but among these the percent viewing the war as immoral has increased and fewer think of it as just a mistake. In both 1969 and in the present, the percent viewing the war as immoral is large but constitutes less than a majority of the class.
Not surprisingly, present opinions about the Vietnam war depend in part on whether or not one served in the military at that time. Among the 81 respondents who volunteered for active duty (many of whom served in Vietnam during the war), only 28 percent now see the war as having been immoral, while 51 percent see it as a mistake and 20 percent say it was fought in the wrong way or lost because of lack of political will. The 16 draftees in our sample are split 50/50 between ‘immoral’ and ‘a mistake,’ and the reservists and National Guard volunteers are also less gung ho (44 percent ‘immoral’, 46 percent ‘mistake’). Fifty-two percent of those who got deferments say the war was immoral, and the most strongly anti-war are the 64 class members who “avoided service in some other way;” 73% of this group, which includes the conscientious objectors in our class, say the war was fundamentally wrong and immoral.
How are we? (Health, exercise, and sex)
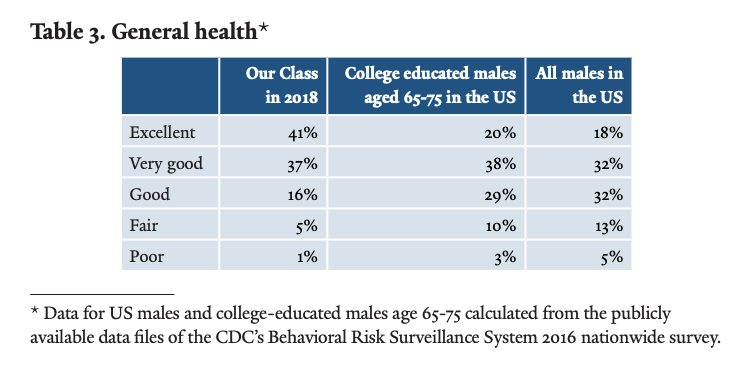
Given that we are, after all, a bunch of old men, we in the Yale Class of 1969 are a notably healthy lot. We asked each classmate to rate his own general state of health. (As subjective as this may seem, extensive research has shown that these self-ratings correlate very well with more objective ratings of health, and the question is widely used in standard health surveys.) As seen in Table 3, 41 percent of us say our health is “excellent,” which is more than twice the percentage that nationally representative samples of men say and double the percentage among a more closely comparable group, college educated men ages 65-75. Only 1.4 percent of our classmates rate their health as “poor.” (However, we should keep in mind—and hold in our thoughts—the small number of classmates whose caregivers informed us they were too ill or too demented to participate in the survey, as well as those who have already passed away.)
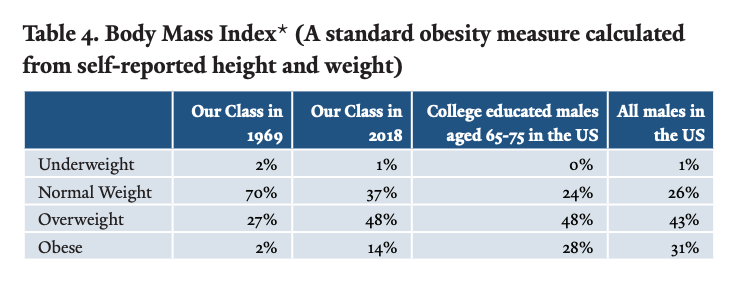
 We asked everybody to tell us their current height and weight, now and back in 1969, and then used those data to compute a “Body Mass Index” for each respondent, then and now. Time has thickened a lot of our waistlines, and America’s obesity epidemic has not spared our class (Table 4). But we are substantially leaner than other college-educated males our age and much less likely to be obese than “all males in the USA” (as reported by the CDC).
While our overall health may be good-to-great, many of us have dealt with (or are dealing with) some serious ailments. Nevertheless, we are more fortunate in this regard than the average American aged 65-75. For example, 22.4 percent of them have had some form of cancer, compared to 14 percent in our class; 22.6 percent have had heart disease, compared to 14 percent in our class; and a whopping 56 percent of U.S. older adults have high blood pressure, compared to 28 percent of us. In addition, 15 percent of us have arthritis (other than rheumatoid), five percent report Type 2 diabetes, four percent have autoimmune diseases like rheumatoid arthritis or Type 1 diabetes, and two percent have had a stroke. Just three classmates (0.5 percent) reported being HIV positive.
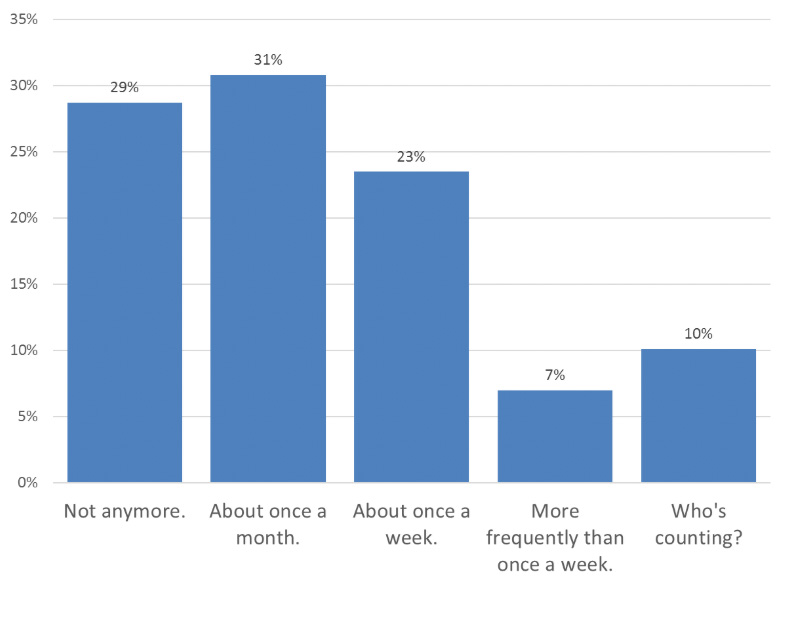
Asked “How many pills do you take a day,” 15 percent take none, 53 percent take 1 to 5 pills, 26 percent take 6 to 10, and 6 percent blithely picked the choice “Who’s counting?” This yields a median daily pill count of 5.
In a section of the questionnaire titled “The Bionic Yale Man,” we asked about medical devices and prostheses. Eighteen percent of us have had dental implants, 14 percent have had lenses in our eyes replaced, six percent have had a hip or two replaced, five percent have new knees and one percent new shoulder joints. Two percent of us have had valves replaced in the heart, four percent are wearing a pacemaker, but just two of our classmates (0.3 percent) have had a heart transplant. The great majority of us wear glasses or contacts (83 percent), one out of ten uses a hearing aid, but only one out of a hundred classmates has had hair transplants or replacements. So: we can show up bald for our reunion and know we’ll be in good company.
Good health is tied to healthy behaviors, so we asked about diet and exercise. Fifteen percent of us are on low-carb diets, while four percent are vegetarians and 2 percent are pescatarians. Only 2 of our classmates (0.3 percent) are currently vegans. Throw in 1 percent currently on the paleo diet and you’re left with 57 percent who say “I’ll eat anything that won’t eat me.” As for exercise, 55 percent reported doing only moderate exercise on a regular basis; 18 percent reported vigorous exercise, and another 18 percent reported doing both moderate and vigorous exercise weekly. Six percent chose the option “I get my exercise acting as pallbearers to my friends who exercise.” As for frequency, the most common choice for either moderate or vigorous exercise was three times a week, but 27 men (five percent) say they do vigorous exercise six or seven times a week. (C’mon guys, aren’t we supposed to be taking it easy?)
Over 95 percent of the class are non-smokers (of tobacco). Fifty-five percent of us never smoked, while another 40 percent are former tobacco smokers who have quit for good. The five percent who smoke regularly or occasionally compares favorably to CDC reports on the frequency of smoking by education (eight percent) and age (nine percent).
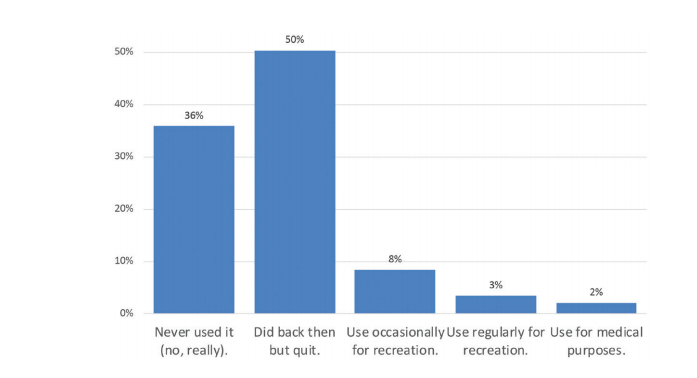
So what about that other weed? Even with the legalization of marijuana in so many states, our usage is surprisingly light—about 14 percent of the total and then mostly only “occasionally.” As Figure 9 shows, about half of the class only smoked marijuana in the past and another third never used pot at all.
Figure 9. Pot Patterns: Use of Marijuana?
 Since the survey was fully anonymous, we felt free to ask about the most intimate of subjects, so we included a simple question: “Have sex?” That was followed with “Need help with sex? Do you use medication like Viagra or Cialis regularly?” Excluding people not answering, the class divides fairly evenly between those who are no longer having sex, those who are active monthly and those who are active one or more times per week. And about 1/3 (36 percent) of those who are sexually active use medication to help with sex.
Figure 10. Have sex?
Overall, it’s clear that we as a class are a fairly healthy bunch, given our status as septuagenarian men. Of course, there’s a bias in these results because our survey could not include men who have passed away or the small number of living classmates whose health or mental status prevented them from responding. There has been much research about the social determinants of health, and our relatively good health is surely a function, in part, of our level of education, our economic status, our high rate of marriage and other indicators of relative privilege that have accrued to our exclusive group. But part of that story is healthy behaviors (like keeping our weight down, exercising regularly and not smoking) for which many of us can claim personal credit. (In many cases, some of that credit must also go to a weary and watchful spouse.) Let us continue in good health and vigor (with or without the help of those pills)!
Just for fun (Pets, sports and underwear preferences)
In the eternal struggle of the dog people versus the cat people, the dog people are dominant in our class. Over three quarters of us (78 percent) have had a pet dog since 1969, but cats put on a good showing, claiming 57 percent of us as owners. (We’re not all dog or cat people though: 20 percent have had neither, and nearly a third (32 percent) have had both at one time or another. Nineteen percent of us have kept fish, 13 percent birds, and small mammals were owned by a robust 12 percent. I guess all those kids had to have their hamsters and gerbils, right?
When it comes to sports, football is king; 70 percent report following the sport regularly. Baseball is the second most popular sport, with 59 percent following it regularly. Basketball is followed by 44 percent of our classmates, but no other sport is followed by more than one in five. Hockey attracts interest from 18 percent, soccer 13 percent and eight percent follow track and field events. One third of us follow other sports regularly, and among these the most frequently mentioned were tennis, golf and sailing.
It was in April 1994 on a nationally televised MTV forum that an impertinent young woman asked the President of the United States, Bill Clinton, “The world is dying to know: boxers or briefs?” (The answer: “Usually briefs.”) We thought it would be fun to ask that same question in the class survey, but to add to the fun we are not disclosing here the actual percentage who report wearing the whitey-tighties versus the loose-trunks version. However, we can report on some actual statistical analysis of the underwear preference patterns of our class. There is a statistically significant correlation of underwear preference with the type of high school a classmate attended, with boxers more highly favored by preppies (those who attended private, residential schools). Public school guys favor briefs, and those who went to private day schools fall somewhere in between. Varsity athletes and those who served on active duty in the military favor boxers more than others. In addition, boxers are significantly more favored by those of us who played on residential college athletic teams while at Yale. Classmates who belonged to fraternities are significantly more likely to wear boxers, while those who were tapped into senior societies are more likely to be wearing briefs. None of the other attributes we measured, from party identification to pot smoking to current net worth to belonging to a music group seems to be correlated with underwear preference. Calling on my background in sociology and reasoning inductively from these findings, I would offer the tentative thesis that—in our class at least—the fashion preference for boxers arises and is reinforced in those settings where men are likely to see each other in partially clothed state (fraternity houses, prep school dorms, locker rooms, military barracks). But perhaps I’m taking this whole underwear thing way too seriously…
Boola, boola: Relationship with Yale
We all sang that “time and change will naught avail to change the friendships formed at Yale.” But 50 years is a long time, and when asked how many Yale classmates they currently consider to be close friends, 36 percent of us reported “none.” Thirty-six percent currently have just one or two close friends from our class, 18 percent have three or four, nine percent report five to nine close friends, and three percent say they have ten or more close friends from our class.
When it comes to attending reunions, 32 percent of the survey respondents have not attended any, 19 percent have come to only one reunion, and the rest have been to more than one. Four percent report that they’ve come to all nine of the every-five-years reunions we’ve held so far. The mean number of reunions attended is 3.2 for men who have been to at least one, but just 2.2 if the never-attended are included. I hope our 50th will bring in nearly all of the former and a good number of the latter group of classmates.
As for more formal involvement with Yale, two thirds of us report no such involvement at all. Fourteen percent are involved in their local Yale club, six percent serve on Alumni Schools Committees, four percent have been involved in Class of 1969 activities other than reunions, two percent are YAF class agents, and 1 percent are AYA representatives.
Forty-three percent of our class say they give money regularly to Yale, and another 22 percent give occasionally. Over a third of the respondents to the survey (35 percent) are not currently giving.
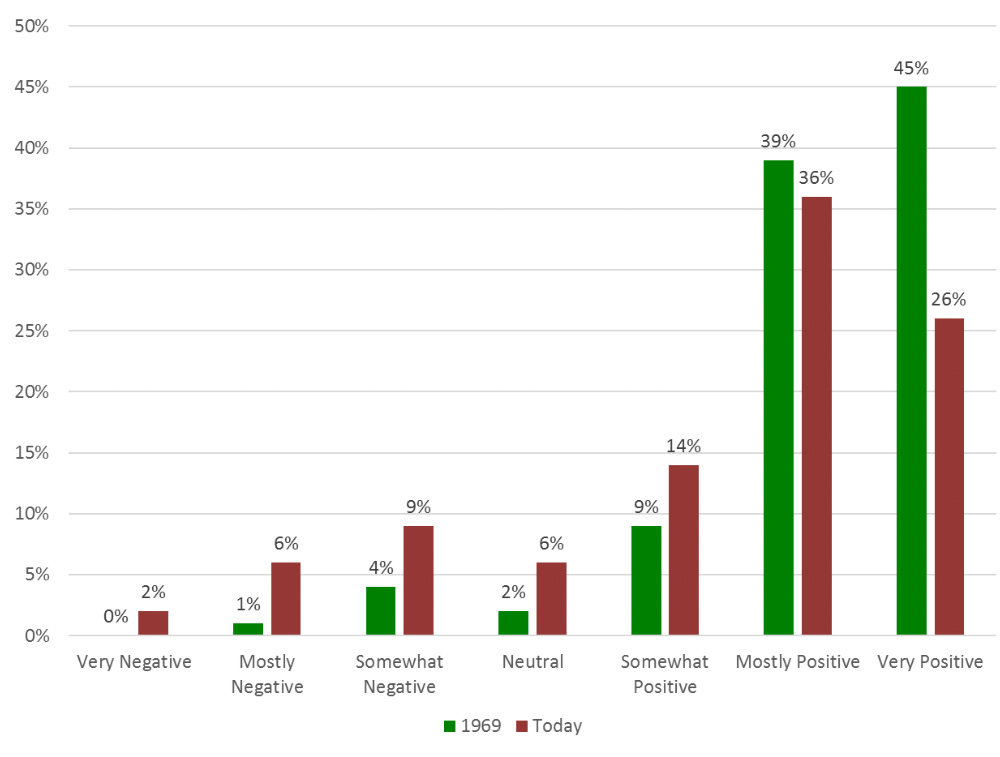
Any of the above could be used as indicators of how members of our class feel about Yale, but we asked them to report their general opinion of the institution, in 1969 and today, using a seven-point scale ranging from “very negative” to “very positive.” As seen in Figure 11, there’s no doubt that most of us loved Mother Yale when we attended here, but it’s also clear that our opinions have shifted toward the negative in the years since. Back then, only one percent of our class held a very negative or mostly negative opinion, but now eight percent are in those categories. And the “very positives” are down from 45 percent in 1969 to only 26 percent today.
Figure 11. General opinion about Yale, then and now.
 To explore these feelings further, we offered two open-response questions: what you like MOST about Yale today, and what you like LEAST. What we liked most, culled from 481 open-ended responses:
- Diversity
- Co-education
- Excellence in academics (student and faculty)
- Intelligence (students and faculty)
- Breadth of opportunities (academic and extracurricular)
- Helping the greater New Haven community
- Inclusivity and openness of students
- Beating Harvard in football
- Availability of financial aid
- Political advocacy of current students.
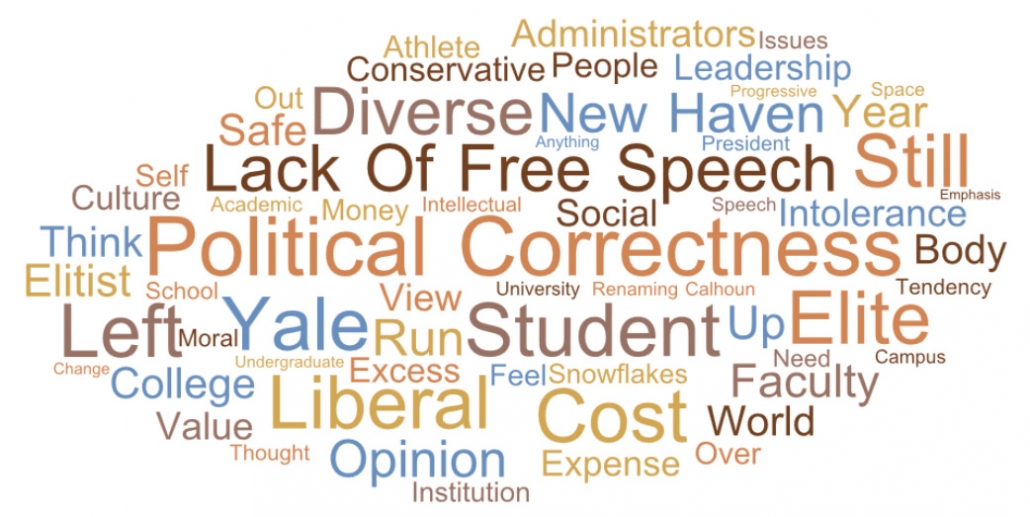
Figure 12 is a computer-generated “word cloud” based on these same text responses. The size of each word indicates its frequency in the responses.
Ironically, some of the things that are liked LEAST about Yale today are similar to the things that some people liked the most:
- Elitism
- Too politically correct
- Cost, a disproportional amount of wealthy students
- Privilege
- Too liberal
- Intolerance of differing opinions
- Location in New Haven
- Donation solicitation letters
Figure 13 is a word cloud based on the 460 responses to the “like least” question.
Figure 12. What we like MOST about Yale today. Figure 13. What we like LEAST about Yale today.
 But lest we dwell too much on these negatives, the following additional results are noteworthy indicators of our sentiments. Seventy-one percent of our classmates believe their time at Yale played a “pivotal role” or an “important role” in bringing them success in their life and career. And when we asked if Yale would still be one of their top choices for a college to attend if they were 18 today and had the right grades and test scores, 82 percent said “yes.”
What we value now
One cannot talk about values in America without considering religion, and the survey included a fairly extensive set of questions about religiosity and religious beliefs, in 1969 and now. Fortunately, our classmate Mike Baum has analyzed these data and written an informative and thoughtful essay, published in this same volume. So here we will simply skip over these questions, other than to note that deeply religious men were and still are in the minority among our classmates.
We examined the broad values of our class in two different ways. First, we offered a list of things that could be important to any of us and asked respondents to rate each one on a seven-point scale from “unimportant” to “very important.” Table 5 shows the percent rating each of these items as “very important.” Family comes first above all else for us. Our health and well-being come next, represented by personal happiness, staying in touch with family and friends, and physical activity. Not far behind are more communal concerns: the well-being of friends and community, helping others, giving back. Personal actualization goals are very important to smaller numbers of us: creativity, reflection, contemplation, personal achievement or getting one’s ideas out to the world. At this point in our lives, monetary success is very important for only seven percent of us.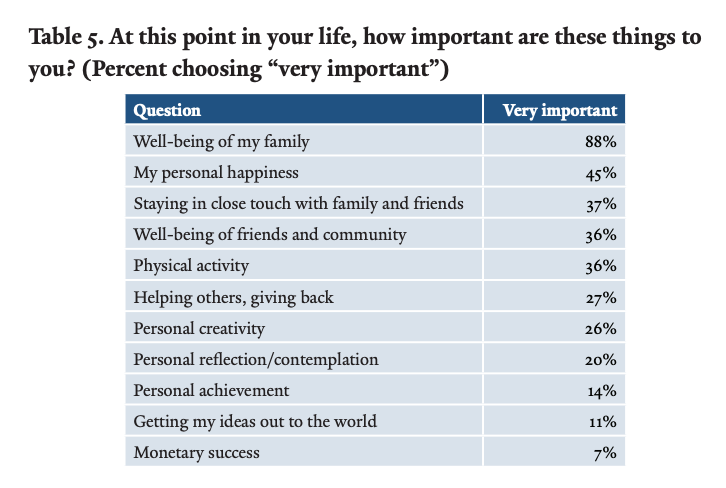
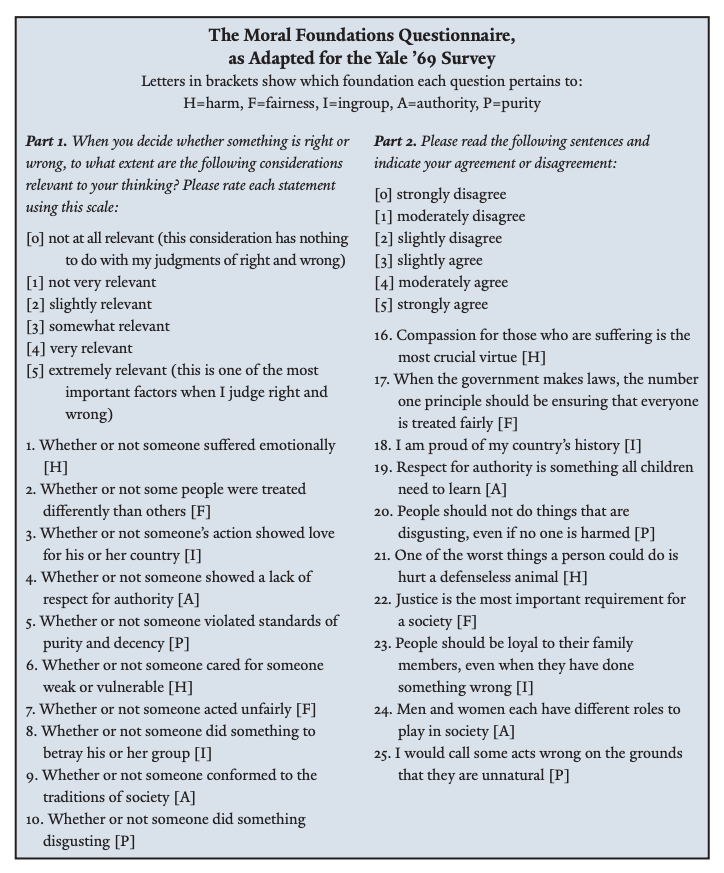
We also undertook a deeper look into the values of our class, by asking each respondent to complete the Moral Foundations Questionnaire developed by psychologist Jonathan Haidt, a former colleague of mine at UVA who has moved on to New York University. Haidt and his colleagues have written extensively on the moral foundations of political thought and our current “culture wars” in the U.S. They pointed out that earlier measures of morality tended to highlight liberal values, while ignoring other values that tend to be important to political conservatives in the U.S. and also to some other cultures around the world. They posit that our decisions about right and wrong tend to be based on pre-rational, deeply rooted, intuitive commitments we may have on any or all of five different dimensions:
- Avoiding Harm to others [H]
- Achieving Fairness to all [F]
- Staying loyal to the In-group [I]
- Respecting and obeying Authority [A]
- Maintaining Purity of body, mind, and self [P]
Their research and that of others have shown that liberals tend to strongly endorse the first two of these values, and tend to base their judgments on social issues primarily on the basis of preventing harm and maximizing fairness (which they tend to define in terms of equality). Conservatives also give strong endorsement to these values (though they may define fairness in terms of proportionality rather than equality), but they also are much more likely to support the latter three values: In-group loyalty, authority, and living a life of purity. Our questionnaire included 20 items, each measured on a 0-to-5 scale, that have been shown to work well as measures of each of the five foundations (four items for each foundation) [see boxed insert below.] We simply added up the answers given for each foundation’s items to yield a score on each dimension for every respondent.
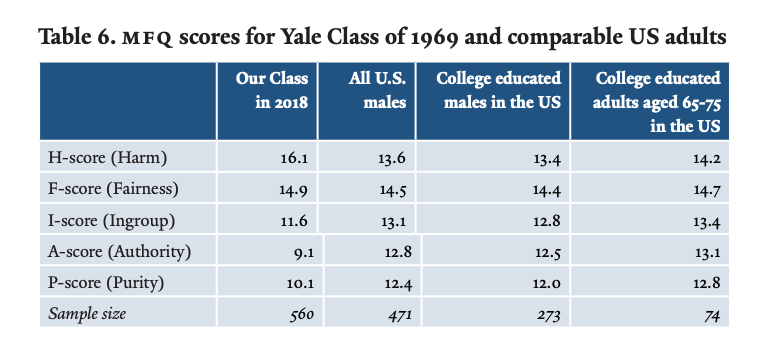
We have seen already that our class is overwhelmingly liberal in its politics and Democratic in its party affiliation. It is no surprise, then, that our class’s profile on the MFQ items fits the liberal pattern, as can be seen clearly in Table 6, which compares the scores for our class to the nationally representative sample tested by Haidt and his associates in 2008. Our class’s score of 14.9 on the Fairness scale is little different from that of all U.S. males, college educated men in the U.S., or college educated adults (including women and men) aged 65-75. However, our score of 16.1 on the Harm scale is far higher than any of the comparison groups. In contrast—and typical of liberal values—we are lower than any of the comparison groups on In-group loyalty, respect for Authority, or the measure of Purity. Of particular note is our very low score on respect for authority, a trait which would come as no surprise to the administrators of Yale during our time in college.
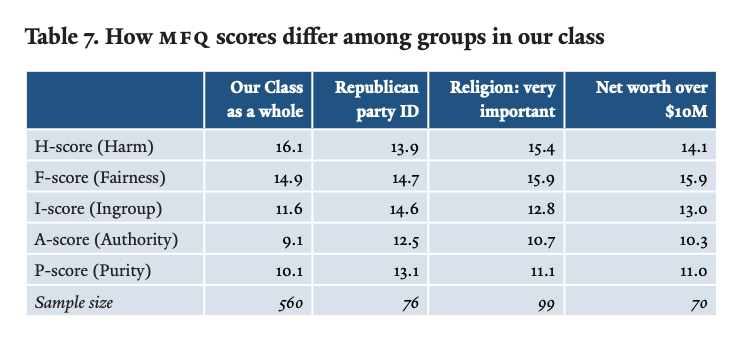
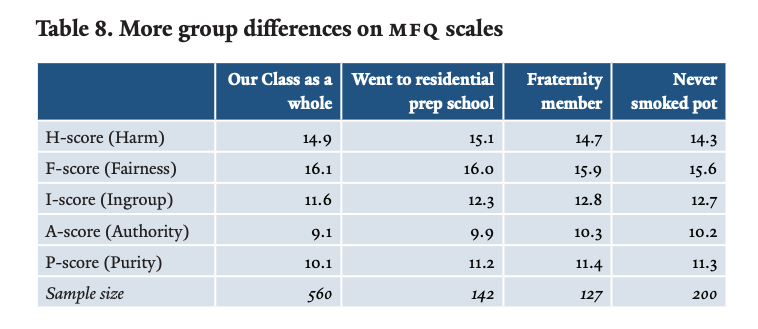
It’s clear again that, as a class, we’re a liberal bunch and we don’t have much of the intuitive reactions to things that distinguish conservatives. But of course, we are not all the same in how we look at moral and political issues. Table 7 and Table 8 examine how different groups within our class differ in their MFQ scores. As expected, Republicans endorse the three ‘conservative’ values much more strongly, scoring 14.6 on In-group (compared to 10.6 for Democrats, not shown in the table). Their scores for Authority and Purity concerns are also markedly higher than those of Dems. Those to whom religion is very important also score higher than average on I, A, and P, but are not as low as Republicans on the liberal values of avoiding Harm and ensuring Fairness. Interestingly, those of our classmates who have achieved a net worth over ten million dollars also register higher scores than the rest of the class on I, A and P. We can see in Table 8 that endorsement of the more conservative values is higher for those who graduated from a private, residential high school; those who belonged to a fraternity while at Yale (note their high score on In-group loyalty), and those who report today that they never smoked pot. Perhaps that choice is related to their higher endorsement of the value of purity.
Not shown in the tables: those who served in the military have higher scores on In-group loyalty, but don’t differ much on their other scores from those who never served. And the scores of varsity athletes look very much like those of fraternity members. It bears repeating that these are the values that classmates endorse now; and if the profiles fit the images of what we recall for different groups from our college days it suggests how persistent our value commitments can be over a lifetime.
Time and change: Retirement and plans for the future
So what now for our class? As of Spring 2018, 38 percent of our classmates were retired, 26 percent were working part-time (that is, partially retired), 30% were working full time because they wanted to, and five percent because they had to. Thirteen percent of us plan to completely retire soon, 11 percent plan to “semi-retire” soon, and a full third of the class (33 percent) say they will probably keep working as long as they can. These figures suggest that by this point in their lives most of us who wanted to retire have done so, and those who haven’t yet done so don’t really plan to.
Eighty-one percent of us plan to stay (or have stayed) in the same community when they enter (or entered) retirement. Nearly everyone (96 percent) plans to live in an ordinary community when they enter retirement—no senior living centers for us.
Though we’ve done well financially for the most part, we are not equally prosperous. Looking at their current financial situation, 21 percent call themselves “affluent,” 35 percent “very comfortable,” 36 percent “comfortable,” seven percent are “getting by,” and only two percent feel like they are currently struggling. We asked how respondents feel that their children are doing financially, compared to where they were at that age. The answers were decidedly mixed: 16 percent said the kids are doing significantly better, 22 percent somewhat better, 18 percent somewhat worse, and 8 percent significantly worse. The other 37 percent said their kids were doing about the same as they had.
One of our closing questions asked our classmates how satisfied they are with the way their life turned out. Thirty-nine percent are very satisfied, 42 percent pretty contented, and 18 percent “wish I could do some things over again.” Only one percent said “I think I messed up.”
We also asked them how they feel about their own future. The answers communicate cautious optimism and motivation from most of us, but not all. Just 11 percent say “the best is yet to be,” 69 percent say “still some things to accomplish,” 13 percent say “It’ll be OK but I don’t expect much new.” Seven percent chose the option “What do you expect, I’m a septuagenarian.” One can almost visualize them throwing up their hands as they answered that one.
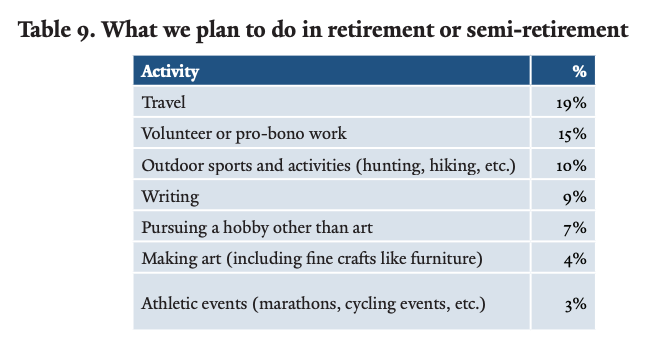
More concretely, we asked respondents to choose from a list the things they plan to use their spare time for in retirement or semi-retirement. Table 9 shows the result, with travel and volunteering topping the list. Our planned activities seem to align well with the things we chose as being important to us (as seen above in Table 5).
Closing thoughts
Surveys are tools for summarizing patterns and trends. The 50th Reunion Survey for the Yale Class of 1969 shows clearly that we’ve done well as a class. This broad-brush portrait shows that we’re a mostly healthy, mostly well-off group of men who have mostly had steady careers, married and raised kids, and done a lot to give back, too. We are decidedly liberal in our political views and in our deeper moral outlook, which tends to give emphasis above all to concerns about avoiding harm and ensuring fairness. Within the overall picture, we see significant variation in our politics and the paths we’ve chosen to take in life; we do differ in our politics, religious views, and on every measure of success and well-being.
If the main theme is one of successful living, then part of being a Yalie is to look at our success with mixed feelings. On the one hand, we know that most of us came from relatively privileged circumstances to begin with, and our status as Yale graduates has, for nearly all of us, conferred a measure of additional privilege. We have seen the envy and resentment that our status arouses in some. And yet we know, too, of how hard each of us worked to get to Yale and to get through all that campus life demanded of us; and we know also the extraordinary talents and human virtues that shine through in so many of our classmates. We were told that we would be leaders, and that’s exactly what so many of us were able to become. We have every reason to take pride in what our class has accomplished, both in the changes we helped bring about at Yale and in all that we’ve each accomplished in the 50 years since.
No survey report can do justice to our individual stories: the challenges we’ve faced, the battles we’ve won and lost, the opportunities missed and the ones we seized against all odds, the people we’ve loved and the ones we’ve lost. But I hope the results I’ve shared here help you to see your own, rich story in the context of what the class as a whole has experienced. Want to hear the real stories of our classmates? Then by all means, come to the 50th reunion and talk with them face to face.


